Panel 0.7.0 Release
We are very pleased to announce the 0.7 release of Panel, which brings a ton of new features, enhancements, and many important bug fixes. Many thanks to the 20 contributors to this release (listed at the bottom). This release introduced only minimal changes in existing APIs, as Panel progresses towards a more stable phase of development. One of the major goals in this release was better compatibility with the Jupyter ecosystem, which culminated in the ipywidgets support. The next major release will be the 1.0 release, which will involve some minor API cleanup and a number of long anticipated features, including a number of polished inbuilt templates and the ability to serve existing Jupyter widgets as part of a Panel app.
Major features:
- Ability to render any Panel output as an ipywidget model (#745, #755, #771)
- Added
.jscallbackmethod to Viewable objects (#665)
New components:
Widgets
- Added new
Progressbar widget (#726) - Added new
DataFrameediting widget (#767) - Added new
PasswordInputwidget (#655) - Added new
TextAreaInputwidget (#658)
Panes
- Added new
DataFramepane with the ability to render pandas, dask and streamz dataframes (#560, #751) - Added new
Streamzpane (#767, #769) - Added new
VTKVolumepane (#605, #606, #715, #729) - Added new
Videopane (#696)
Layouts
- Added new
GridBoxlayout (#608, #761, #763) - Added new
Dividercomponent (#756)
Enhancements:
- Major improvements to the
Pipelineobject to allow branching graphs (#712, #735, #737, #770) - Ability to bi-directionally link objects in Javascript using
.jslink(#764) - Make Row/Column scrollable (#760)
- Added repr and a kill_all_servers method to pn.io.state.state (#697)
- Templates can now render inside a notebook cell (#666)
- WidgetBox can be disabled programmatically (#532)
API Changes:
- The
Audiowidget has been deprecated in favor of aAudiopane. (#696)
If you are using Anaconda, you can get latest Panel with conda install -c pyviz panel , and using pip you can install it with pip install panel.
ipywidget support
Panel is built on top of Bokeh, which ships with its own standalone server and has also provided some degree of integration in Jupyter. Panel itself has relied on some custom extensions for Jupyter support which don’t necessarily work in some non-standard notebook and Jupyter environments such as the recently released Voilà dashboard server. After working with the Jupyter and Bokeh developers we have now released the jupyter_bokeh library and extension which allows displaying Bokeh and Panel models as ipywidgets and therefore ensures that bi-directional communication works in any environment that supports the Jupyter widget protocol.
In Panel we can enable this globally using pn.extension(comm='ipywidgets') or by explicitly converting a panel object to an ipywidget using pn.ipywidget(obj).
import ipywidgets as ipw

accordion = ipw.Accordion(children=[
    pn.ipywidget(pn.Column(
        pn.widgets.FloatSlider(),
        pn.widgets.TextInput()
    )),
    pn.ipywidget(hv.Curve([1, 2, 3])),
    pn.ipywidget(hv.Area([1, 2, 3]).opts(responsive=True, min_height=300))
])

accordion.set_title(0, 'Widgets')
accordion.set_title(1, 'Curve')
accordion.set_title(2, 'Area')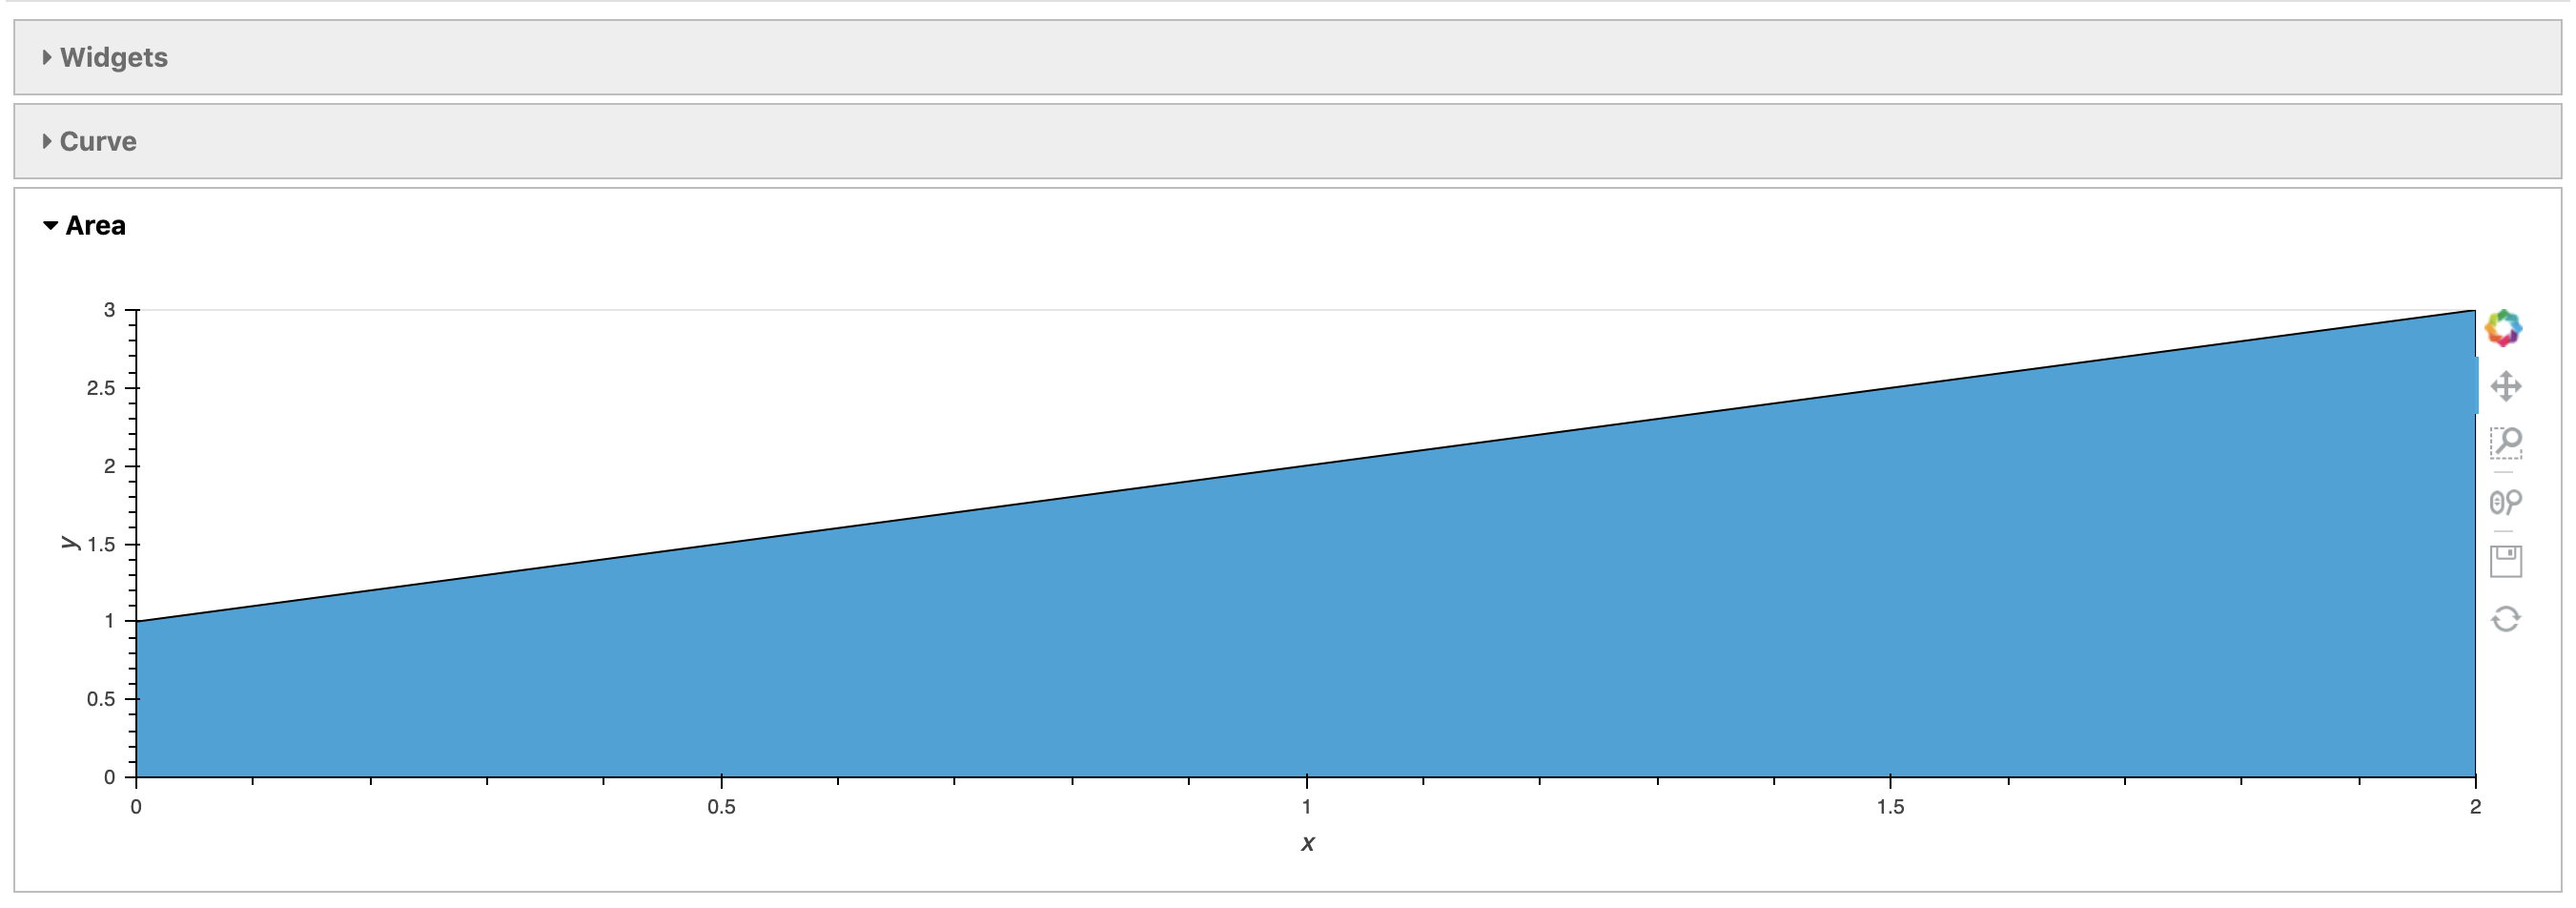
Support for .jscallback and improved .jslink
Panel has long had support for linking the parameters of two objects in Javascript using the .jslink method. In this release .jslink can now be invoked bi-directionally:
kwargs = dict(start=0, end=1, step=0.1, align='center')
slider = pn.widgets.FloatSlider(name='Slider', **kwargs)
spinner = pn.widgets.Spinner(name='Spinner', **kwargs)

slider.jslink(spinner, value='value', bidirectional=True)

pn.Row(slider, spinner)
There is also now a .jscallback method, for generating arbitrary JavaScript callbacks in response to some change to a property:
value1 =   pn.widgets.Spinner(value=0, width=75)
operator = pn.widgets.Select(value='*', options=['*', '+'], width=50, align='center')
value2 =   pn.widgets.Spinner(value=0, width=75)
button =   pn.widgets.Button(name='=', width=50)
result =   pn.widgets.StaticText(value='0', width=50, align='center')

button.jscallback(clicks="""
if (op.value == '*')
  result.text = (v1.value * v2.value).toString()
else
  result.text = (v1.value + v2.value).toString()
""", args={'op': operator, 'result': result, 'v1': value1, 'v2': value2})

pn.Row(value1, operator, value2, button, result)
Improved Pipelines
Previously the Pipeline class allowed setting up linear pipelines to implement a multi-stage workflow. The Pipeline class was completely overhauled in this release to make it easy to lay out the individual components yourself and most importantly to set up an arbitrary graph of pipeline stages. Pipelines now allow diverging and converging branches for more flexible workflows than before. Below is the definition and the overview of a complex graph-based pipeline with diverging and converging stages:
dag = pn.pipeline.Pipeline()

dag.add_stage('Input', Input)
dag.add_stage('Multiply', Multiply)
dag.add_stage('Add', Add)
dag.add_stage('Result', Result)
dag.add_stage('Export', Export)

dag.define_graph({'Input': ('Multiply', 'Add'), 'Multiply': 'Result', 'Add': 'Result', 'Result': 'Export'})
Improved Templates
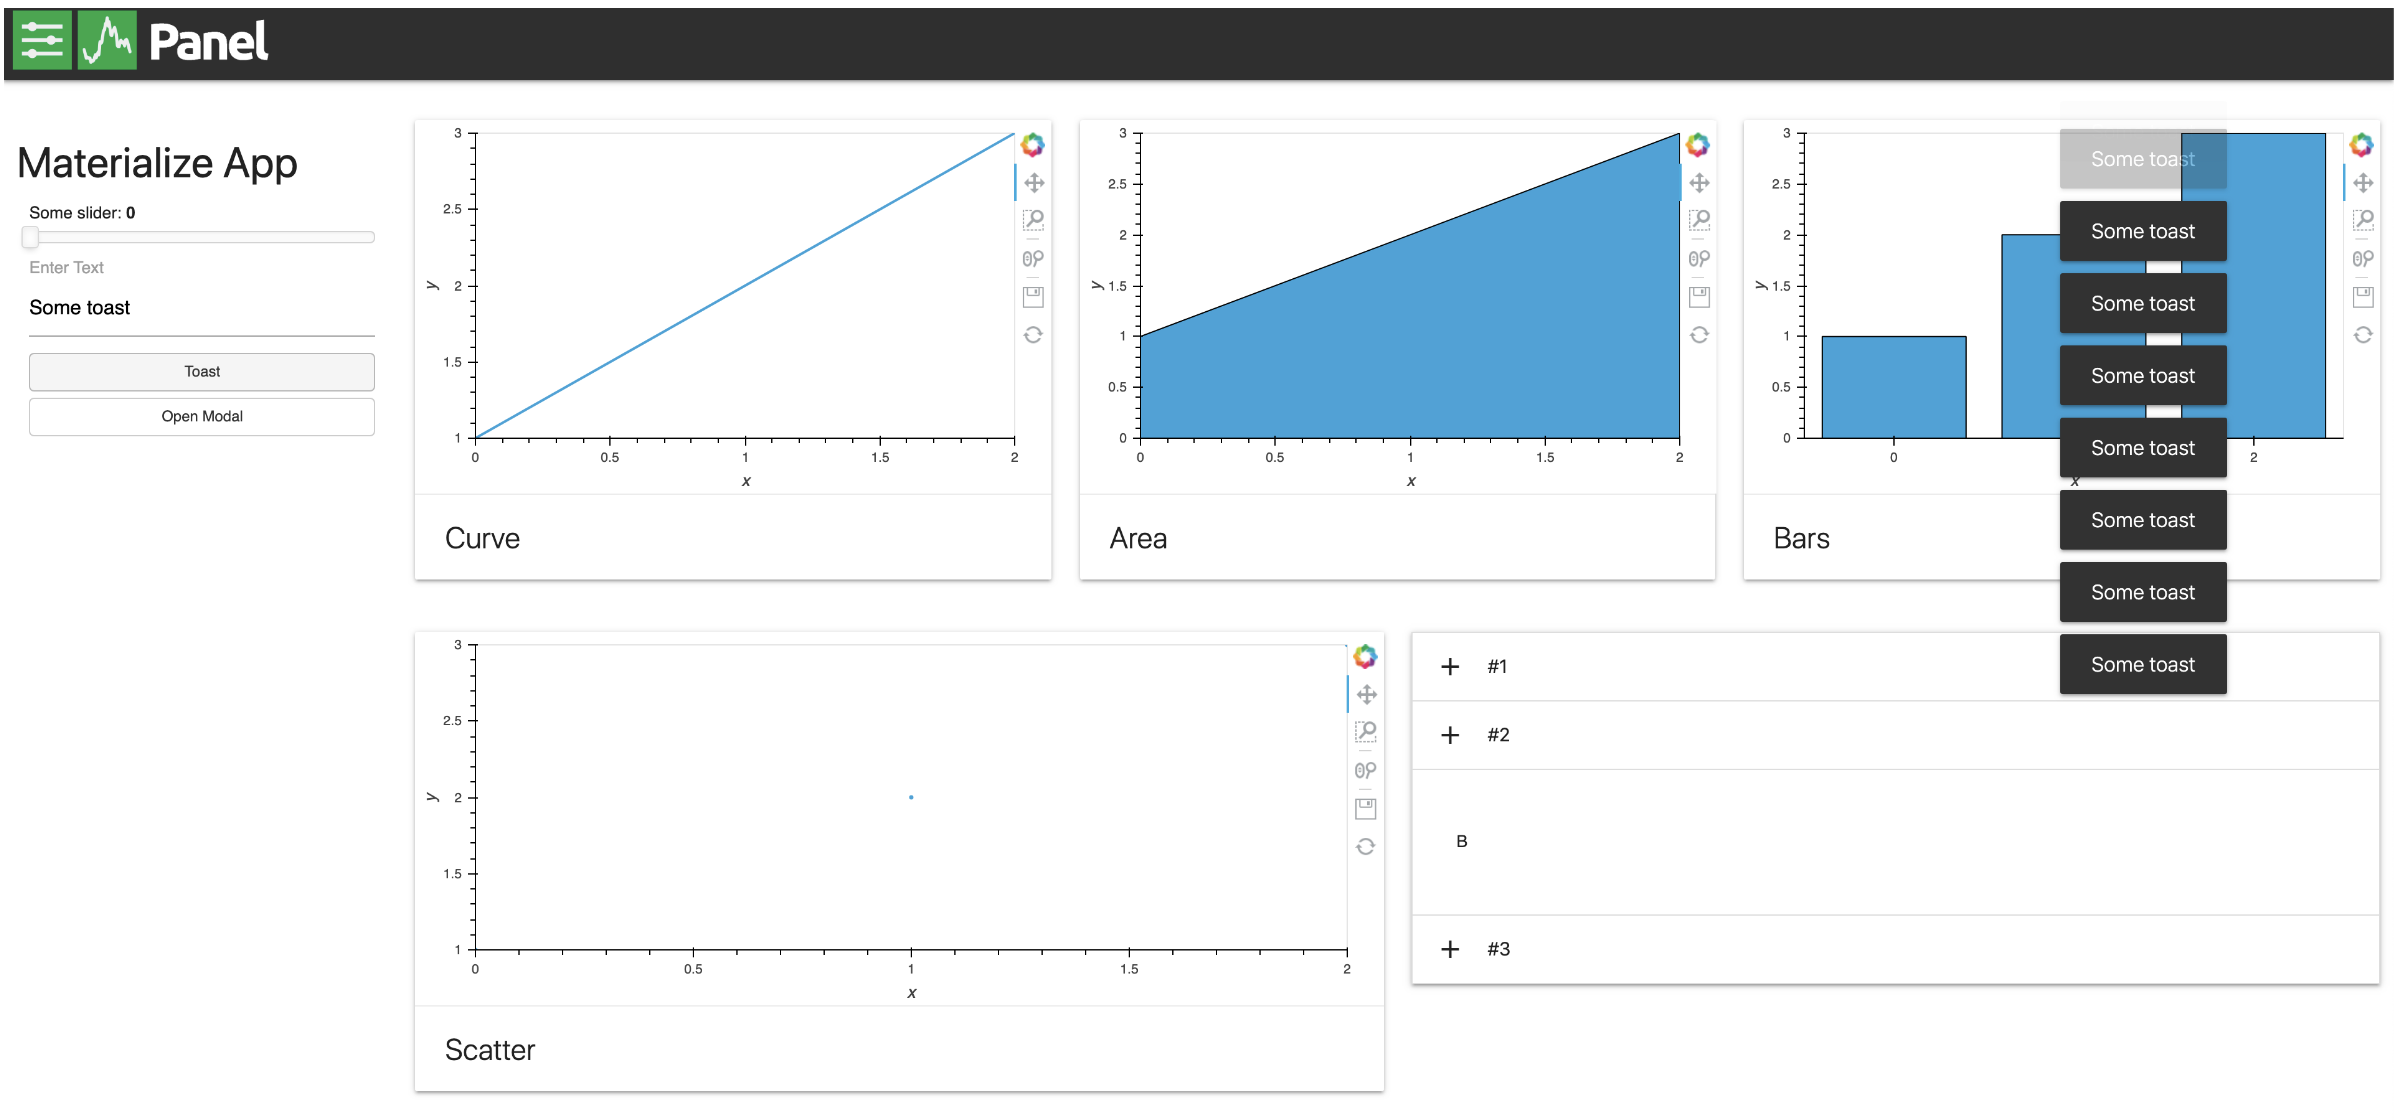
Since Panel 0.6 it has been possible to declare custom Templates to take full control over the layout and visual styling of the application or dashboard. In this release we now support rendering custom templates in a notebook and even declaring separate templates for notebook and server usage. In the next release we will focus on providing a number of custom templates built on common JS/CSS frameworks such as Materialize UI, GridStack, and reveal.js.
New Components
This release includes a variety of new components contributing to the growing set of widgets, panes, and layouts showcased in the reference gallery.
Progress bars
The Progress widget displays the progress towards some target based on the current value and the max value. If no value is set the Progress widget is in indeterminate mode and will either be static or animated depending on the active parameter. If you are able to measure or estimate how much progress is remaining on an operation, you can use this widget to give feedback to the user.
DataFrame widget
The DataFrame widget allows editing an existing pandas DataFrame using a custom DataTable. Here, each of the numbers and strings are user-editable, which will be reflected in the contents of the DataFrame in Python when there is a live server available.
import pandas as pd

df = pd.DataFrame({'int': [1, 2, 3], 'float': [3.14, 6.28, 9.42], 'str': ['A', 'B', 'C']}, index=[1, 2, 3])

pn.widgets.DataFrame(df, widths={'index': 10, 'int': 10, 'float': 50, 'str': 100}, width=200)
PasswordInput & TextAreaInput widgets
New PasswordInput and TextAreaInput make it possible to enter hidden text and provide multi-line text inputs to Panel:
DataFrame Pane
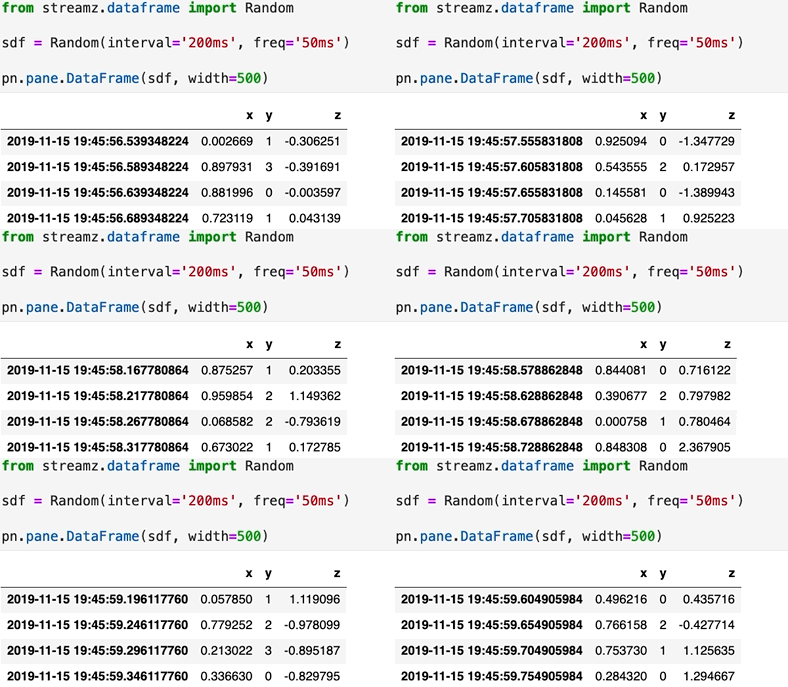
The DataFrame pane renders Pandas, Dask and Streamz dataframes while exposing a range of options to control the formatting.
Streamz Pane
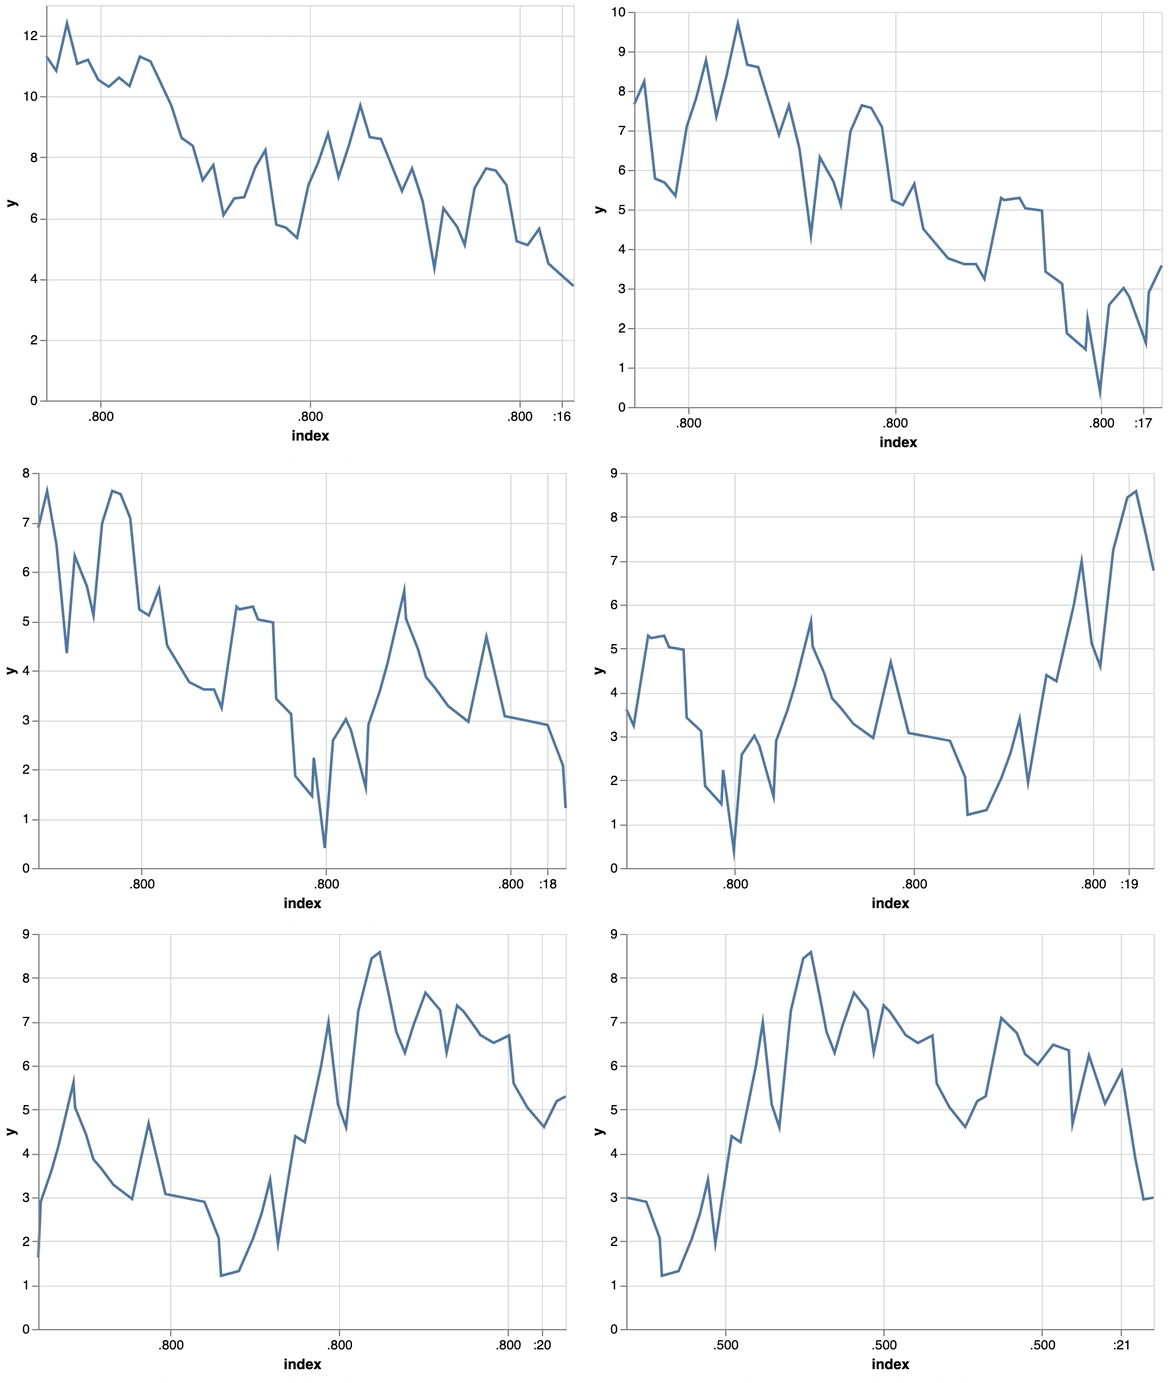
The Streamz pane accepts any streamz Stream to allow streaming arbitrary objects. The basic example in the documentation demonstrates how to quickly put together a streaming vega plot:
Video Pane
The Video pane uses a standard HTML5 media player widget to display any mp4, webm, or ogg video file. Like the corresponding Audio pane, the current timestamp, volume, and play state can be toggled from Python and Javascript:
video = pn.pane.Video('https://sample-videos.com/video123/mp4/720/big_buck_bunny_720p_1mb.mp4',
                      width=640, height=480)

video
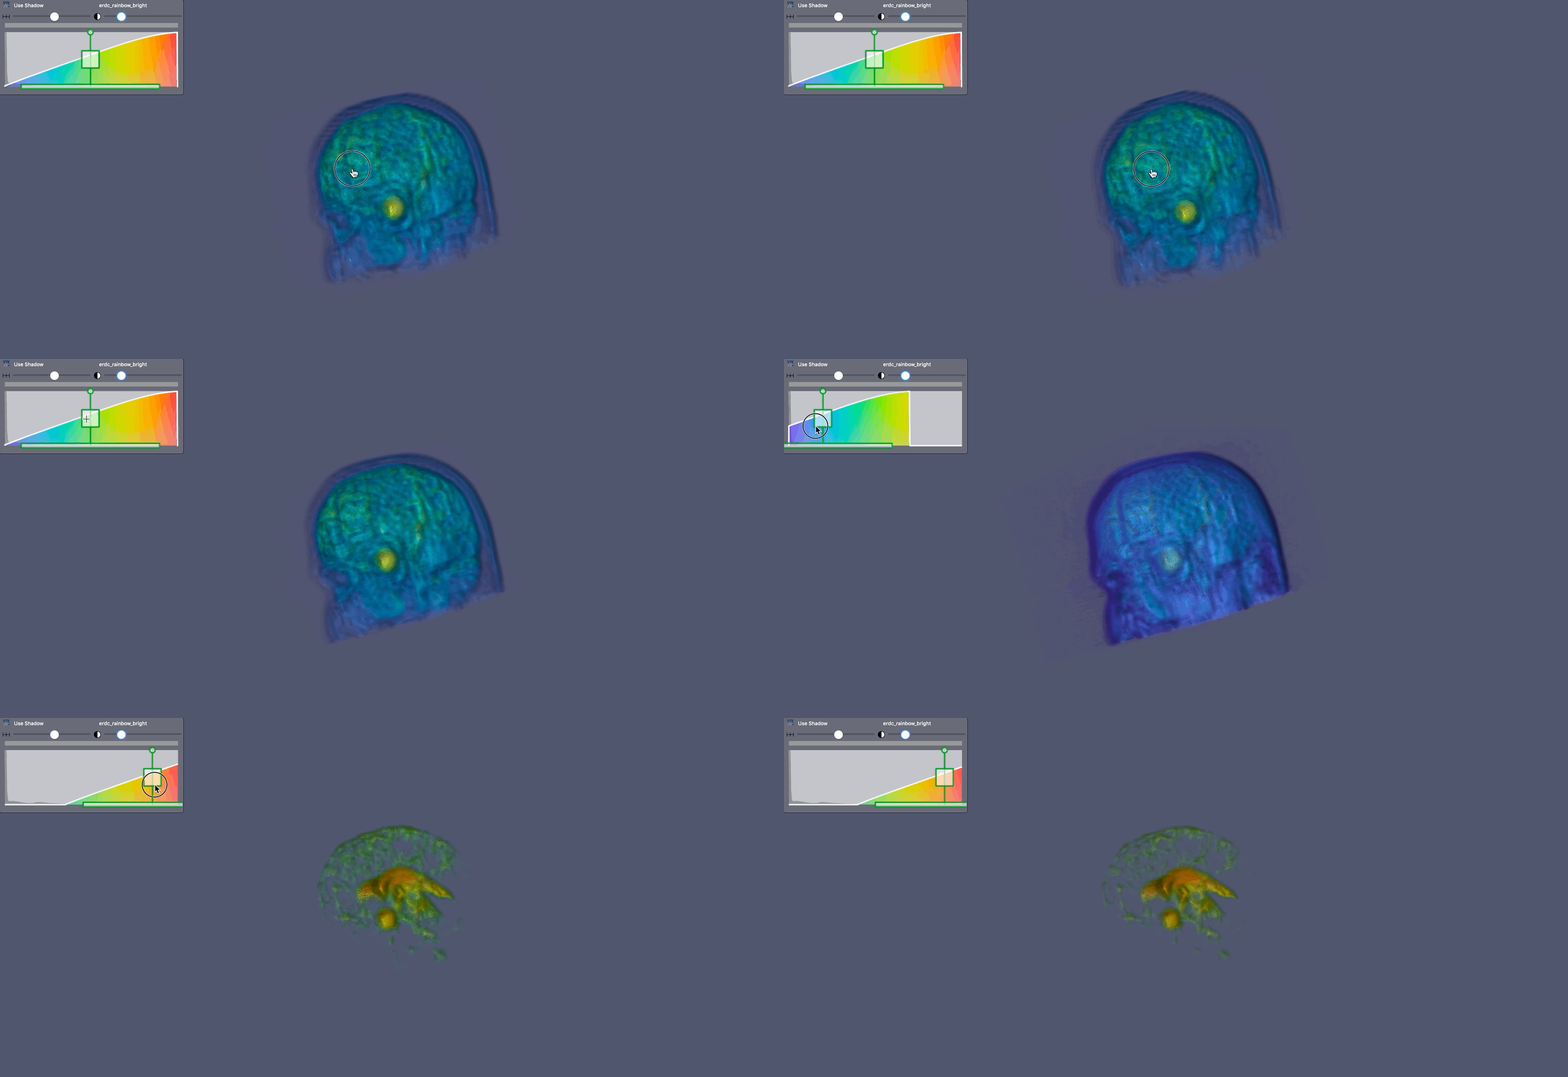
VTKVolume
The VTKVolume pane uses the vtk.js library to render interactive, volumetric 3D plots with control over opacity and the color curve.
GridBox layout
The new GridBox layout complements the existing Row, Column, Tabs, and GridSpec layouts in that it allows wrapping the list of items provided to it by the desired number of rows or columns:
rcolor = lambda: "#%06x" % random.randint(0, 0xFFFFFF)

box = pn.GridBox(*[pn.pane.HTML(background=rcolor(), width=50, height=50) for i in range(22)], ncols=4)
Divider
The new Divider component also nicely complements the existing Spacer components making it easy to draw a visual divider between vertically stacked components.
pn.Column(
    pn.layout.Divider(),
    pn.Row(pn.layout.HSpacer(), '# Title', pn.layout.HSpacer()),
    pn.layout.Divider()
)
Contributors
Many thanks to the many contributors to this release:
- Philipp Rudiger (@philippjfr): Maintainer & lead developer
- Xavier Artusi (@xavArtley): VTK support
- James A. Bednar (@jbednar): Documentation
- Andrew Tolmie (@DancingQuanta): FileInput widget
- Arne Recknagel (@a-recknagel): Python 3.8 support, build improvements
- Julius Winkelmann (@julwin): TextAreaInput, PasswordInput
- Pav A (@rs2): Example notebooks
- Ed Jung (@xtaje): Default values fix
- Karthick Perumal (@Karamya): Audio widget enhancements
- Christopher Ball (@ceball): Build and doc improvements
- Andrew Huang (@ahuang11): Disabling widget boxes
- Eduardo Gonzalez (@eddienko): Fixing Django docs
- Jacob Barhak (@Jacob-Barhak): Updated Markdown docs
- Jean-Luc Stevens (@jstevens): Cross-selector fixes
- Julia Signell (@jsignell): Documentation fixes
- Landung “Don” Setiawan (@lsetiawan): StoppableThread improvements
- Mateusz Paprocki (@mattpap): Build infrastructure
- Maxime Borry (@maxibor): Widget fixes
- Stefan Farmbauer (@RedBeardCode): File-like object support on images
- @kleavor: Fixed GridSpec override behavior