import param
import numpy as np
import xarray as xr
import panel as pn
import hvplot.xarray
import geoviews as gv
import holoviews as hv
from geoviews.streams import PolyDraw
from metpy.interpolate import cross_section
import cartopy.crs as ccrs
pn.extension()
gv.extension("bokeh")HoloViews Streams for Exploring Multidimensional Data
holoviews
streams
Explores a 4D dataset (time, level, lat, lon) dataset using HoloViews and Panel.
Follow along to build an app that uses a 4D dataset (level, time, lat, lon) and explore it by
- slicing it in time and level
- plotting the data on a map
- plotting the data as a cross section
Basics
Import the necessary libraries
Most of the time, using Python is just knowing what’s out there and importing it!
Getting something working
Below I show three ways to download a piece of the NCEP Reanalysis dataset from NOAA.
It’s one of my favorite datasets for testing and writing examples because it’s so straightforward to use: - no API key required, which means no need to sign up, verify email, etc. - can be small or large, if 4X daily, concatenated across times, variables, etc - is multi-dimensional (time, level, lat, lon)
Below are three variations of downloading a dataset. Note, 1 only works in notebooks; 2 and 3 work in both notebooks and scripts.
Since I usually work in a Jupyter notebook, I like to use 1 due to its simplicity–just a ! + wget + copied url and an optional --no-clobber, -nc flag.
# 1.
!wget -nc https://downloads.psl.noaa.gov/Datasets/ncep.reanalysis/Dailies/pressure/air.2024.nc
# 2.
# import subprocess
# subprocess.run("wget https://downloads.psl.noaa.gov/Datasets/ncep.reanalysis/Dailies/pressure/air.2024.nc", shell=True)
# 3.
# import requests
# with requests.get("https://downloads.psl.noaa.gov/Datasets/ncep.reanalysis/Dailies/pressure/air.2024.nc") as response:
# response.raise_for_status()
# with open("air.2024.nc", "wb") as f:
# f.write(response.content)File ‘air.2024.nc’ already there; not retrieving.
The hardest part for any projects is getting started (something about static friction > kinetic friction).
However, once you get started, things get easier, so what I usually do is take baby steps and get something shown up front immediately.
Fortunately, XArray + hvPlot makes it possible!
ds = xr.open_dataset("air.2024.nc", drop_variables=["time_bnds"])
ds<xarray.Dataset>
Dimensions: (level: 17, lat: 73, lon: 144, time: 80)
Coordinates:
* level (level) float32 1e+03 925.0 850.0 700.0 ... 50.0 30.0 20.0 10.0
* lat (lat) float32 90.0 87.5 85.0 82.5 80.0 ... -82.5 -85.0 -87.5 -90.0
* lon (lon) float32 0.0 2.5 5.0 7.5 10.0 ... 350.0 352.5 355.0 357.5
* time (time) datetime64[ns] 2024-01-01 2024-01-02 ... 2024-03-20
Data variables:
air (time, level, lat, lon) float32 ...
Attributes:
Conventions: COARDS
title: mean daily NMC reanalysis (2014)
history: created 2013/12 by Hoop (netCDF2.3)
description: Data is from NMC initialized reanalysis\n(4x/day). It co...
platform: Model
dataset_title: NCEP-NCAR Reanalysis 1
References: http://www.psl.noaa.gov/data/gridded/data.ncep.reanalysis...base_map = ds.hvplot("lon", "lat")
base_mapCustomizing
Add keywords such as coastline, cmap, and framewise=False (for consistent colorbar) to the call for a much more polished plot!
For better compatibility, I convert longitudes from 0:360 to -180:180 and sort–many packages just work better that way.
# for interactivity purposes on the blog, limit the number of times and levels
ds_sel = ds.isel(time=slice(0, 3), level=slice(0, 8))
ds_sel["lon"] = (ds_sel["lon"] + 180) % 360 - 180
ds_sel = ds_sel.sortby("lon")
map_plot = ds_sel.hvplot(
"lon",
"lat",
coastline=True,
cmap="RdYlBu_r",
clabel="Air Temperature [K]",
framewise=False,
dynamic=False,
)
map_plotFixed latitude cross section
We can easily show a static, vertical cross section of the dataset too!
ds_cs = ds_sel.sel(lat=50) # cross section across 50°N
# cs -> cross section
cs_plot = ds_cs.hvplot(
"lon",
"level",
cmap="RdYlBu_r",
clabel="Air Temperature [K]",
flip_yaxis=True,
framewise=False,
dynamic=False,
)
cs_plot/Users/ahuang/miniconda3/envs/panel/lib/python3.10/site-packages/holoviews/core/data/xarray.py:340: UserWarning: The `squeeze` kwarg to GroupBy is being removed.Pass .groupby(..., squeeze=False) to disable squeezing, which is the new default, and to silence this warning.
for k, v in dataset.data.groupby(index_dims[0].name):
WARNING:param.Image10741: Image dimension level is not evenly sampled to relative tolerance of 0.001. Please use the QuadMesh element for irregularly sampled data or set a higher tolerance on hv.config.image_rtol or the rtol parameter in the Image constructor.
WARNING:param.Image10741: Image dimension level is not evenly sampled to relative tolerance of 0.001. Please use the QuadMesh element for irregularly sampled data or set a higher tolerance on hv.config.image_rtol or the rtol parameter in the Image constructor.
WARNING:param.Image10779: Image dimension level is not evenly sampled to relative tolerance of 0.001. Please use the QuadMesh element for irregularly sampled data or set a higher tolerance on hv.config.image_rtol or the rtol parameter in the Image constructor.
WARNING:param.Image10779: Image dimension level is not evenly sampled to relative tolerance of 0.001. Please use the QuadMesh element for irregularly sampled data or set a higher tolerance on hv.config.image_rtol or the rtol parameter in the Image constructor.
WARNING:param.Image10817: Image dimension level is not evenly sampled to relative tolerance of 0.001. Please use the QuadMesh element for irregularly sampled data or set a higher tolerance on hv.config.image_rtol or the rtol parameter in the Image constructor.
WARNING:param.Image10817: Image dimension level is not evenly sampled to relative tolerance of 0.001. Please use the QuadMesh element for irregularly sampled data or set a higher tolerance on hv.config.image_rtol or the rtol parameter in the Image constructor.Diagonal cross section
This is only a cross section across a fixed latitude; what if we wanted a cross section across a diagonal?
We can use MetPy’s cross_section function to interpolate the data along any line!
It’s crucial to note that the start and end keywords follow latitude-longitude (y, x) pair, NOT (x, y)!
ds_sel = ds_sel.metpy.parse_cf() # so it contains proper metadata for metpy to recognize
ds_cs = cross_section(ds_sel.isel(time=0), start=(50, -130), end=(50, -50))
ds_cs<xarray.Dataset>
Dimensions: (level: 8, index: 100)
Coordinates:
* level (level) float32 1e+03 925.0 850.0 700.0 600.0 500.0 400.0 300.0
time datetime64[ns] 2024-01-01
metpy_crs object Projection: latitude_longitude
lon (index) float64 -130.0 -129.4 -128.7 ... -51.3 -50.65 -50.0
lat (index) float64 50.0 50.27 50.53 50.79 ... 50.79 50.53 50.27 50.0
* index (index) int64 0 1 2 3 4 5 6 7 8 9 ... 91 92 93 94 95 96 97 98 99
Data variables:
air (level, index) float64 281.1 280.8 280.5 ... 225.2 225.4 225.7
Attributes:
Conventions: COARDS
title: mean daily NMC reanalysis (2014)
history: created 2013/12 by Hoop (netCDF2.3)
description: Data is from NMC initialized reanalysis\n(4x/day). It co...
platform: Model
dataset_title: NCEP-NCAR Reanalysis 1
References: http://www.psl.noaa.gov/data/gridded/data.ncep.reanalysis...Since the x dimension is now index, we need to also properly format the xticks labels with lat and lon coordinates.
xticks = [
(i, f"({abs(lon):.0f}°W, {lat:.0f}°N)") # format the xticks
for i, (lat, lon) in enumerate(zip(ds_cs["lat"], ds_cs["lon"]))
]
ds_cs.hvplot(
"index",
"level",
cmap="RdYlBu_r",
xticks=xticks[::15],
xlabel="Coordinates",
clabel="Air Temperature [K]",
flip_yaxis=True,
framewise=False,
dynamic=False,
)WARNING:param.Image11026: Image dimension level is not evenly sampled to relative tolerance of 0.001. Please use the QuadMesh element for irregularly sampled data or set a higher tolerance on hv.config.image_rtol or the rtol parameter in the Image constructor.
WARNING:param.Image11026: Image dimension level is not evenly sampled to relative tolerance of 0.001. Please use the QuadMesh element for irregularly sampled data or set a higher tolerance on hv.config.image_rtol or the rtol parameter in the Image constructor.Joined together
Finally, we can lay both plots by “adding” them.
(map_plot + cs_plot).cols(1)Checkpoint 1
Here’s a cleaned up, copy/pastable version of the code thus far!
import subprocess
from pathlib import Path
import param
import numpy as np
import xarray as xr
import panel as pn
import hvplot.xarray
import geoviews as gv
import holoviews as hv
from geoviews.streams import PolyDraw
from metpy.interpolate import cross_section
import cartopy.crs as ccrs
pn.extension()
gv.extension("bokeh")
if not Path("air.2024.nc").exists():
subprocess.run("wget https://downloads.psl.noaa.gov/Datasets/ncep.reanalysis/Dailies/pressure/air.2024.nc", shell=True)
# process data
ds = xr.open_dataset("air.2024.nc", drop_variables=["time_bnds"])
ds_sel = ds.isel(time=slice(0, 3), level=slice(0, 10)).metpy.parse_cf()
ds_sel["lon"] = (ds_sel["lon"] + 180) % 360 - 180
ds_sel = ds_sel.sortby("lon")
ds_cs = cross_section(ds_sel.isel(time=0), start=(50, -130), end=(50, -50))
# visualize data
map_plot = ds_sel.hvplot(
"lon",
"lat",
coastline=True,
cmap="RdYlBu_r",
clabel="Air Temperature [K]",
framewise=False,
dynamic=False,
)
xticks = [
(i, f"({abs(lon):.0f}°W, {lat:.0f}°N)")
for i, (lat, lon) in enumerate(zip(ds_cs["lat"], ds_cs["lon"]))
]
cs_plot = ds_cs.hvplot(
"index",
"level",
xticks=xticks[::15],
xlabel="Coordinates",
cmap="RdYlBu_r",
clabel="Air Temperature [K]",
flip_yaxis=True,
framewise=False,
dynamic=False,
)
(map_plot + cs_plot).cols(1)Working with streams
Now that we have a foundation, we can attach a stream to the plo to allow users to interact with the plot.
To see what streams are available, I check out the HoloViews Reference Gallery.
Since I want to draw a line across the map to eventually show a cross section, I chose PolyDraw.
Minimal example
To start using:
- click on the PolygonDraw tool in the toolbar
- double tap on the plot to start drawing a polygon
- single tap on each vertex of the polygon
- double tap on the last vertex to finish drawing
cs_path = gv.Path(([-80, -50, -30], [28, 48, 18]), crs=ccrs.PlateCarree())
stream = PolyDraw(source=cs_path, num_objects=1)
cs_pathWe can access the data from the drawn path using the stream.data attribute.
stream.data{'xs': [array([-80. , -53.67907524, -50. , -35.41679382,
-30. ])],
'ys': [array([28. , 45.54728317, 48. , 26.12519073, 18. ])]}Let’s make something happen when we draw a path on the map by using a DynamicMap.
The DynamicMap will mirror the vertexes of the drawn data.
import geoviews as gv
def copy_and_shift_up(data):
# error handling; return empty points if there's no data or there are no valid edges
if not data or not data["xs"] or data["xs"][0][0] == data["xs"][0][1]:
return gv.Points({"Longitude": [], "Latitude": []})
xs = data["xs"][0] # 0 to select first edge
ys = data["ys"][0]
return gv.Points({"Longitude": xs, "Latitude": ys}).opts(color="red")
cs_path = gv.Path(([-80, -50, -30], [28, 48, 18]), crs=ccrs.PlateCarree()).opts(active_tools=["poly_draw"])
stream = PolyDraw(source=cs_path, num_objects=1)
cs_path_shifted = gv.DynamicMap(copy_and_shift_up, streams=[stream])
cs_path + cs_path_shifted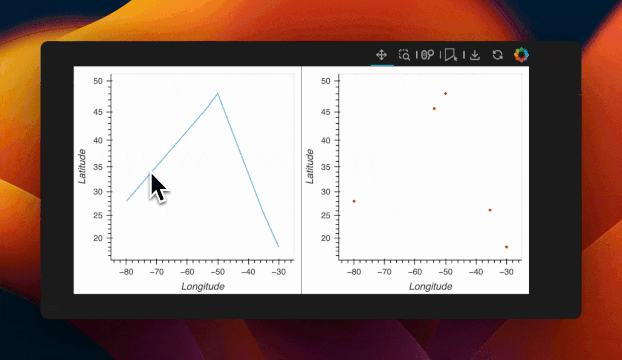
We can see that the right plot reacts to changes to the drawn path on the left plot.
Interactive cross section
Now, let’s take a step back to get back to the original goal, which is we want to create a cross section plot based on the path drawn on the map.
We can do this by:
- Linking the cross section path (
cs_path) to the map by overlaying and laying out the map alongside the cross section plot. - Wrapping the cross section computation and plot inside a
DynamicMapso that changes to thecs_pathdata changes triggers an update to the cross section. - Using a for loop for the cross section computation to handle multiple edges / segments drawn.
Since the data returned from cs_path ranges from -180 to 180, we’ll need to match that in our dataaset too.
def create_cross_section(data):
if not data or not data["xs"] or data["xs"][0][0] == data["xs"][0][1]:
return hv.Image([]).opts(width=730, colorbar=True)
xs = data["xs"][0]
ys = data["ys"][0]
ds_cs_list = []
for i in range(len(xs) - 1): # create cross section for each segment
ds_cs_list.append(
cross_section(
ds_sel.isel(time=0),
start=(ys[0 + i], xs[0 + i]),
end=(ys[1 + i], xs[1 + i]),
)
)
ds_cs = xr.concat(ds_cs_list, dim="index")
xticks = [
(i, f"({abs(lon):.0f}°W, {lat:.0f}°N)")
for i, (lat, lon) in enumerate(zip(ds_cs["lat"], ds_cs["lon"]))
]
cs_plot = ds_cs.hvplot(
"index",
"level",
xticks=xticks[::15],
xlabel="Coordinates",
cmap="RdYlBu_r",
flip_yaxis=True,
dynamic=False,
)
return cs_plot
# create stream
cs_path = gv.Path([], crs=ccrs.PlateCarree()).opts(color="red", line_width=2)
stream = PolyDraw(source=cs_path, num_objects=1)
# attach stream
cs_plot = gv.DynamicMap(create_cross_section, streams=[stream])
# layout
map_overlay = (map_plot * cs_path).opts(active_tools=["poly_draw"])
(map_overlay + cs_plot).cols(1)WARNING:param.Image41637: Image dimension level is not evenly sampled to relative tolerance of 0.001. Please use the QuadMesh element for irregularly sampled data or set a higher tolerance on hv.config.image_rtol or the rtol parameter in the Image constructor.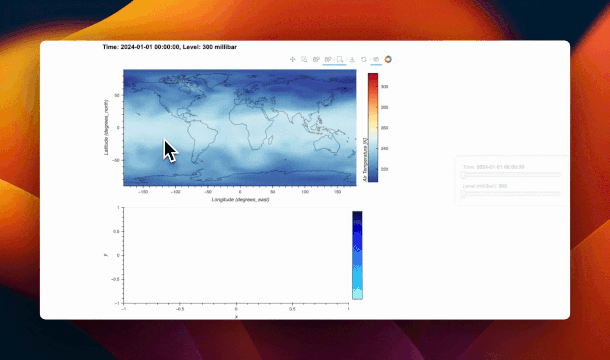
Syncing time slider across plots
Since the time slider only affects the first plot, we’ll need to convert the HoloMap overlay into a pn.pane.HoloViews object to extract the time slider.
We can then easily extract the widget from the map_plot and use it with the cs_plot!
map_pane = pn.pane.HoloViews(map_overlay)Call widget box to get the time slider.
time_slider = map_pane.widget_box[0]
time_sliderWe change:
- our callback slightly to include the time slider’s param value (very important to use
.param.valueinstead of.valueor else it won’t update!) - use
sel(time=value)instead ofisel(time=0).
def create_cross_section(data, value): # new kwarg
if not data or not data["xs"] or data["xs"][0][0] == data["xs"][0][1]:
return hv.Image([]).opts(width=730, clabel="Air Temperature [K]", colorbar=True)
xs = data["xs"][0]
ys = data["ys"][0]
ds_cs_list = []
for i in range(len(xs) - 1):
ds_cs_list.append(
cross_section(
ds_sel.sel(time=value),
start=(ys[0 + i], xs[0 + i]),
end=(ys[1 + i], xs[1 + i]),
)
)
ds_cs = xr.concat(ds_cs_list, dim="index")
ds_cs["index"] = np.arange(len(ds_cs["index"]))
xticks = [
(i, f"({abs(lon):.0f}°W, {lat:.0f}°N)")
for i, (lat, lon) in enumerate(zip(ds_cs["lat"], ds_cs["lon"]))
]
cs_plot = ds_cs.hvplot(
"index",
"level",
xticks=xticks[::15],
xlabel="Coordinates",
cmap="RdYlBu_r",
clabel="Air Temperature [K]",
flip_yaxis=True,
dynamic=False,
)
return cs_plot
cs_plot = gv.DynamicMap(create_cross_section, streams=[stream, time_slider.param.value]) # new streamNow, let’s put everything together!
We need to use pn.Column instead of adding here because map_overlay is no longer a HoloViews object.
pn.Row(pn.Column(map_pane, cs_plot), map_pane.widget_box)Checkpoint 2
Here’s the copy pastable code for the second checkpoint:
import subprocess
from pathlib import Path
import param
import numpy as np
import xarray as xr
import panel as pn
import hvplot.xarray
import geoviews as gv
import holoviews as hv
from geoviews.streams import PolyDraw
from metpy.interpolate import cross_section
import cartopy.crs as ccrs
pn.extension()
gv.extension("bokeh")
def create_cross_section(data, value):
if not data or not data["xs"] or data["xs"][0][0] == data["xs"][0][1]:
return hv.Image([]).opts(width=730, clabel="Air Temperature [K]", colorbar=True)
xs = data["xs"][0]
ys = data["ys"][0]
ds_cs_list = []
for i in range(len(xs) - 1):
ds_cs_list.append(
cross_section(
ds_sel,
start=(ys[0 + i], xs[0 + i]),
end=(ys[1 + i], xs[1 + i]),
)
)
ds_cs = xr.concat(ds_cs_list, dim="index")
ds_cs["index"] = np.arange(len(ds_cs["index"]))
xticks = [
(i, f"({abs(lon):.0f}°W, {lat:.0f}°N)")
for i, (lat, lon) in enumerate(zip(ds_cs["lat"], ds_cs["lon"]))
]
cs_plot = ds_cs.hvplot(
"index",
"level",
xticks=xticks[::15],
xlabel="Coordinates",
cmap="RdYlBu_r",
clabel="Air Temperature [K]",
flip_yaxis=True,
dynamic=False,
)
return cs_plot
if not Path("air.2024.nc").exists():
subprocess.run("wget https://downloads.psl.noaa.gov/Datasets/ncep.reanalysis/Dailies/pressure/air.2024.nc", shell=True)
# process data
ds = xr.open_dataset("air.2024.nc", drop_variables=["time_bnds"])
ds_sel = ds.isel(time=slice(0, 3), level=slice(0, 10)).metpy.parse_cf()
ds_sel["lon"] = (ds_sel["lon"] + 180) % 360 - 180
ds_sel = ds_sel.sortby("lon")
# create base map
map_plot = ds_sel.hvplot(
"lon",
"lat",
coastline=True,
cmap="RdYlBu_r",
clabel="Air Temperature [K]",
framewise=False,
dynamic=False,
)
# create stream
cs_path = gv.Path([], crs=ccrs.PlateCarree()).opts(color="red", line_width=2)
stream = PolyDraw(source=cs_path, num_objects=1)
# overlay
map_overlay = (map_plot * cs_path).opts(active_tools=["poly_draw"])
map_pane = pn.pane.HoloViews(map_overlay)
# attach stream
time_slider = map_pane.widget_box[0]
cs_plot = gv.DynamicMap(create_cross_section, streams=[stream, time_slider.param.value])
pn.Row(pn.Column(map_pane, cs_plot), map_pane.widget_box)Encapsulating into param class
Now, as you may notice, things are getting a tad complex and out of hand.
For the finale, I’ll demonstrate how to convert this into an extensible pn.viewable.Viewer class.
The main things I changed was:
- hvPlot -> HoloViews
- Creating a class to watch time and label
- Manually creating
DynamicMaps for each plot and writing their own custom callbacks - Move streams to
@param.depends
import param
import numpy as np
import xarray as xr
import panel as pn
import hvplot.xarray
import geoviews as gv
import holoviews as hv
from geoviews.streams import PolyDraw
from metpy.interpolate import cross_section
import cartopy.crs as ccrs
pn.extension()
gv.extension("bokeh")
class DataExplorer(pn.viewable.Viewer):
ds = param.ClassSelector(class_=xr.Dataset)
time = param.Selector()
level = param.Selector()
def __init__(self, ds: xr.Dataset, **params):
super().__init__(**params)
self.ds = ds
# populate selectors
self.param["time"].objects = list(
ds["time"].dt.strftime("%Y-%m-%d %H:%M").values
)
self.param["level"].objects = list(ds["level"].values)
self.time = self.param["time"].objects[0]
self.level = self.param["level"].objects[0]
@param.depends("time", "level")
def _update_map(self):
ds_sel = self.ds.sel(time=self.time, level=self.level)
return gv.Image(
ds_sel,
kdims=["lon", "lat"],
vdims=["air"],
).opts(
cmap="RdYlBu_r",
clabel="Air Temperature [K]",
responsive=True,
xaxis=None,
yaxis=None,
)
@param.depends("_stream.data", "time")
def _update_cross_section(self):
data = self._stream.data
if not data or not data["xs"]:
data["xs"] = [[-80, -80]]
data["ys"] = [[18, 28]]
ds_sel = self.ds.sel(time=self.time)
ds_sel = ds_sel.metpy.parse_cf()
xs = data["xs"][0]
ys = data["ys"][0]
ds_cs_list = []
for i in range(len(xs) - 1):
ds_cs_list.append(
cross_section(
ds_sel,
start=(ys[0 + i], xs[0 + i]),
end=(ys[1 + i], xs[1 + i]),
)
)
ds_cs = xr.concat(ds_cs_list, dim="index")
ds_cs["index"] = np.arange(len(ds_cs["index"]))
xticks = [
(i, f"({lon:.0f}°E, {lat:.0f}°N)")
for i, (lat, lon) in enumerate(zip(ds_cs["lat"], ds_cs["lon"]))
]
x_indices = np.linspace(0, len(xticks) - 1, 10).astype(int)
xticks = [xticks[i] for i in x_indices]
cs_plot = hv.Image(ds_cs, kdims=["index", "level"], vdims=["air"]).opts(
xticks=xticks,
xlabel="Coordinates",
cmap="RdYlBu_r",
clabel="Air Temperature [K]",
invert_yaxis=True,
responsive=True,
xrotation=45,
)
return cs_plot
def __panel__(self):
# create widgets
time_slider = pn.widgets.DiscreteSlider.from_param(self.param["time"])
level_slider = pn.widgets.DiscreteSlider.from_param(self.param["level"])
# create plots
self._cs_path = gv.Path([], crs=ccrs.PlateCarree()).opts(
color="red", line_width=2
)
self._stream = PolyDraw(source=self._cs_path, num_objects=1)
map_plot = gv.DynamicMap(self._update_map)
coastline = gv.feature.coastline()
map_overlay = (map_plot * self._cs_path * coastline).opts(
active_tools=["poly_draw"]
)
self._cs_plot = gv.DynamicMap(self._update_cross_section).opts(framewise=False)
sidebar = pn.Column(time_slider, level_slider)
main = pn.Row(map_overlay, self._cs_plot, sizing_mode="stretch_both")
return pn.template.FastListTemplate(
sidebar=[sidebar],
main=[main],
).show()
ds = xr.open_dataset("air.2024.nc", drop_variables=["time_bnds"])
DataExplorer(ds)Launching server at http://localhost:58591
Now, you could extend this easily and cleanly by adding new methods, like if you added a points stream:
@param.depends("_point_stream.data", "level")
def _update_cross_section_timeseries(self):
...Our Discourse community is here for you!